Using PVS-Studio extension for Visual Studio Code
You can view PVS-Studio reports in Visual Studio Code with the help of a special PVS-Studio extension. This documentation explains how to install the extension, start the project analysis, open the PVS-Studio report, and handle it.
Please note that you will first need to download and install the analyzer.
Installing PVS-Studio extension
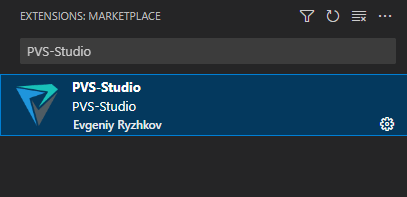
To install the PVS-Studio extension, open Visual Studio Code and click the 'Extensions' tab. Then, type 'PVS-Studio' in the search box and click 'Install':
When installing the analyzer on Windows, you can select 'Integration with Visual Studio Code' and then the extension will be added to Visual Studio Code automatically.
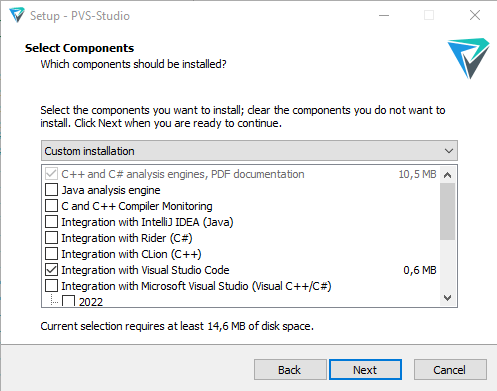
You can also install the extension on Windows with the help of the pvs-studio-vscode-*.vsix file located in the PVS-Studio directory (%PROGRAMFILES(x86)%\PVS-Studio by default).
To install the plugin from the .vsix file, click the three dots in the upper right corner of the 'Extensions' tab. Then, select 'Install from VSIX...':
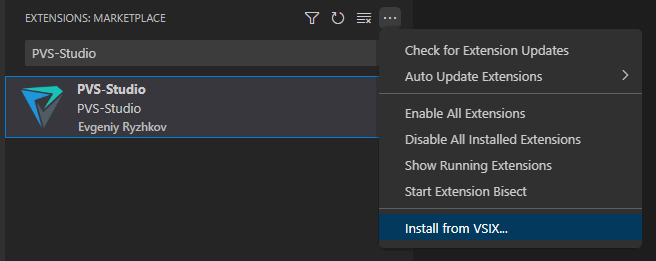
Select the .vsix file of the PVS-Studio plugin in the appeared window. After installing the plugin, restart Visual Studio Code.
You can also install the extension or download the .vsix file from the PVS-Studio page in the Visual Studio Marketplace.
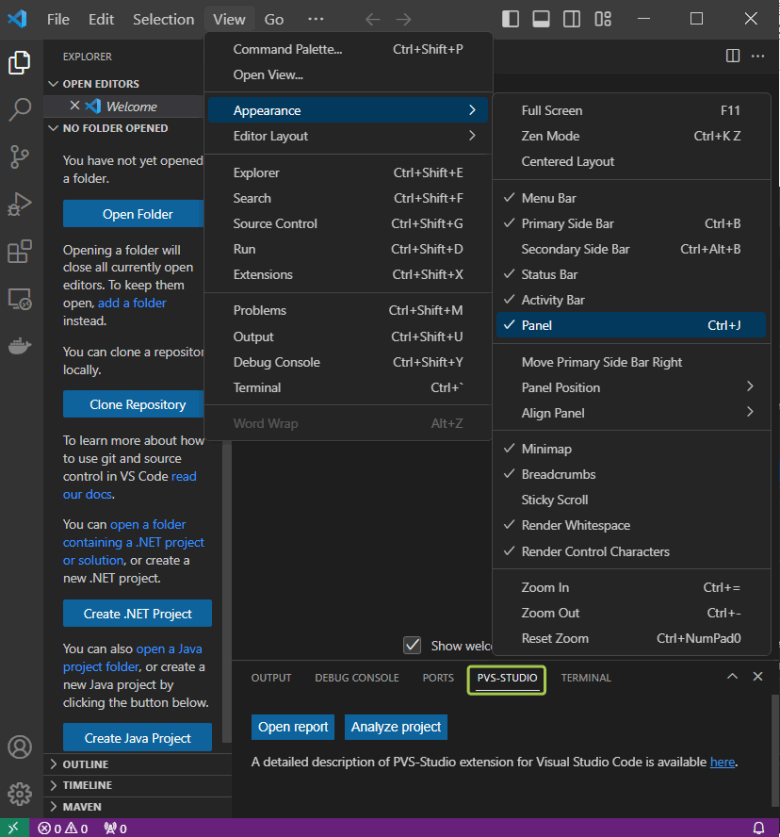
After you install the extension, the PVS-Studio window appears as one of the tabs in the Visual Studio Code bottom panel. If the window is hidden, use the 'PVS-Studio: Show window' command in the command palette (Ctrl + Shift + P) to show it again.
Running analysis
You can run the analysis in several ways:
1. Using the 'Analyze project' button in the PVS-Studio window:
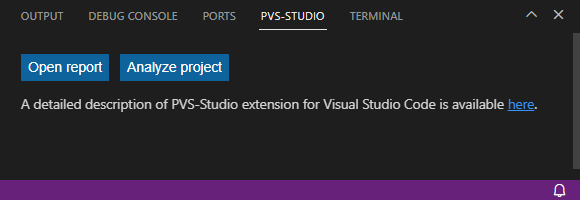
In this case, you run the analysis for the entire solution.
2. Using the context menu of the code editor:
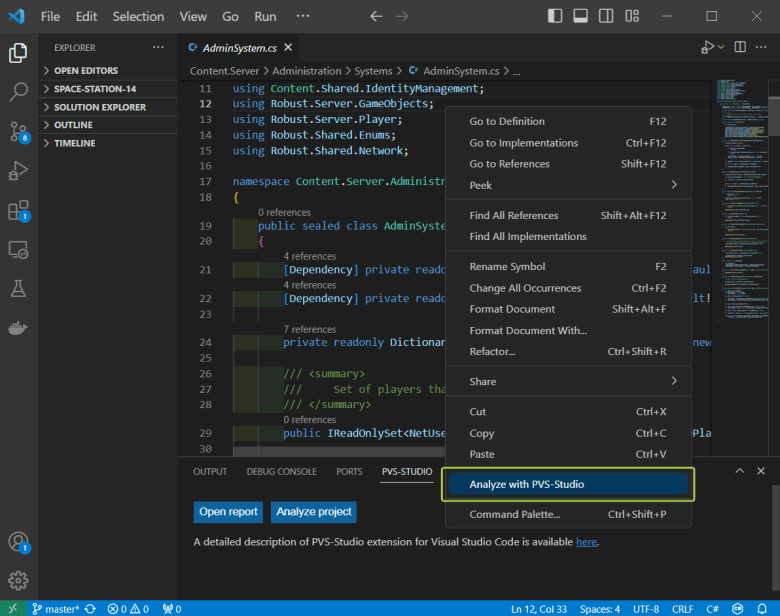
In this case, you run the analysis for a single file. Please note: if you don't have this menu item, it indicates that analysis of the current file is not supported.
3. Using the File Explorer context menu:
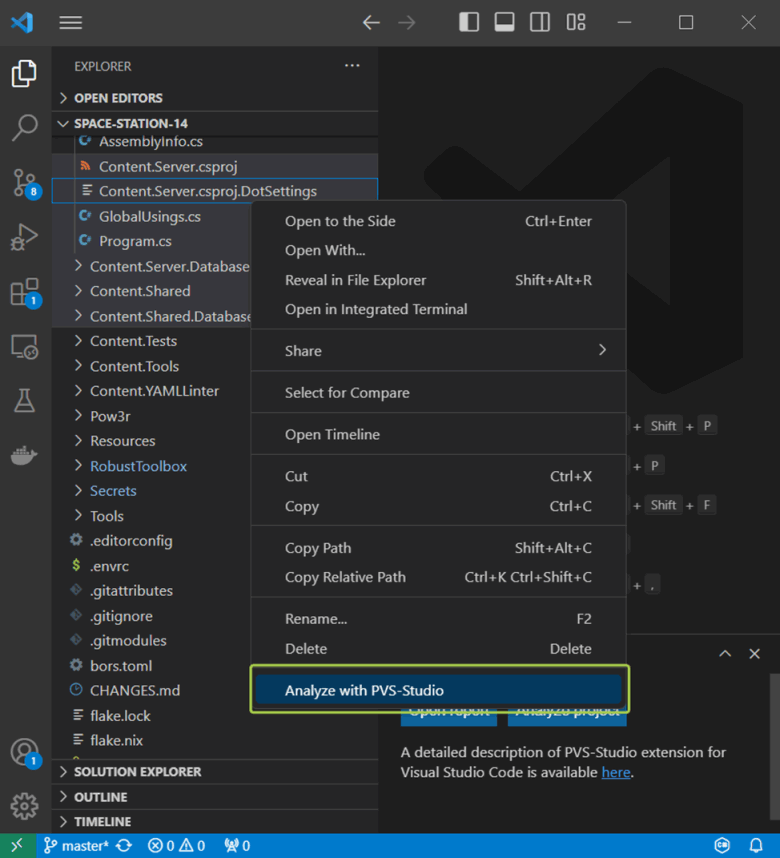
In this case, you run the analysis for all supported files which have been selected. there is a folder among the selected items, the analyzer will run the analysis for all supported files and subfolders it contains.
4. Using the tab group menu of the editor:
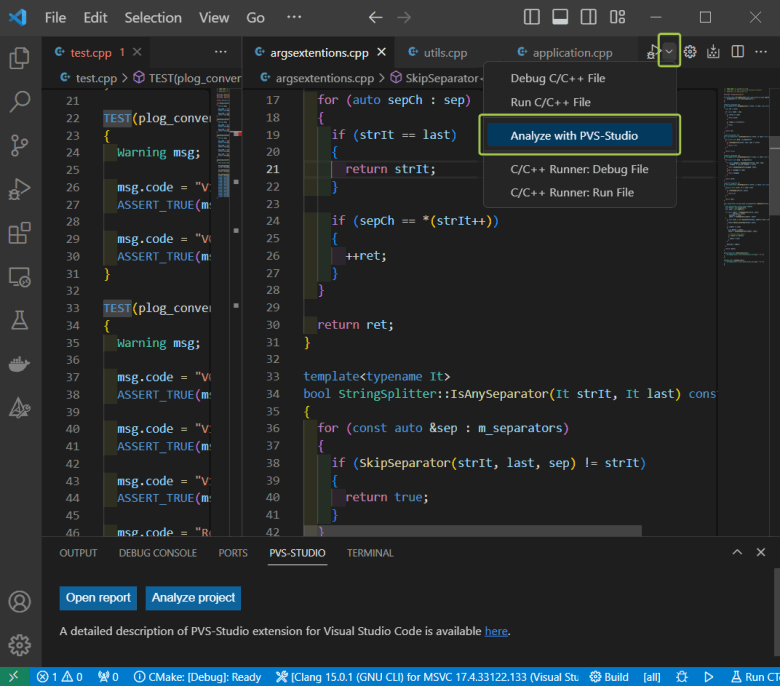
In this case, you run the analysis for all supported files which are opened in the current tab group.
5. Using the 'Run regular analysis' and 'Run intermodular analysis' commands in the command palette (Ctrl+Shift+P):
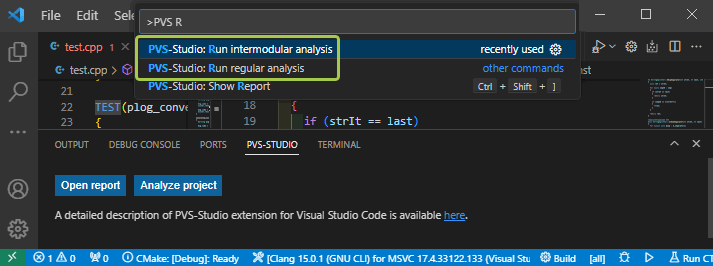
Both commands are used to run the common analysis of the solution. The difference between them matters only when you analyze C and C++ code. In this mode, the analyzer performs deeper analysis but spends more time.
If the analyzer can't find a suitable target for analysis in the VS Code directory, you will receive the following message:
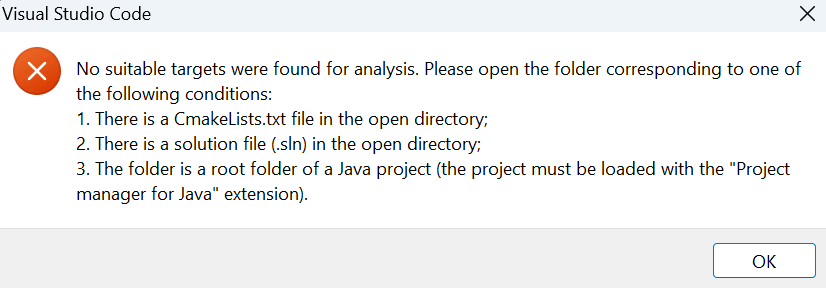
Otherwise, you may be prompted to set up parameters that are specific to analyze projects that use a particular build system. To learn more about analyzing a specific type of project, please consult the 'Analyzing C, C++ (CMake) projects', 'Analyzing C# (MSBuild) projects', and 'Analyzing Java projects' sections.
If the analysis is running successfully, the PVS-Studio window will look as follows:

The analysis progress is displayed in percentage in the upper-right corner of the window. If you need to stop the analysis, click 'Stop' button. The analyzer displays warnings in the table as they are received.
Analyzing C, C++ (CMake) projects
Install the CMake Tools extension for VSCode before running the analysis.
The plugin is compatible with the following generators:
- Ninja;
- Makefile Generators.
If an unsupported or missing generator is detected, a message prompts you to set this parameter in the CMake-Tools settings:

To open this settings window, click the 'Edit setting' button.

Before starting the analysis, you can select the type of analysis: intermodular analysis or regular analysis. The intermodular analysis takes longer than regular analysis but gives better results. To learn more about this mode, please consult the documentation.
When running the analysis, the analyzer also considers the contents of the '.PVS-Studio' folder in the project's source code directory. If the analyzer the user configuration files (with *.pvsconfig extension) or the suppress files (with *.suppress.json extension) are detected there, it will take them into account for further processing.
Note: at the moment, the PVS-Studio plugin for CMake supports the handling of only one suppress file. A special entry will appear in the report if multiple suppress files are found. It will also indicate which file is being used in the analysis.
Analyzing C# (MSBuild) projects
When analyzing the MSBuild solution for the first time, you will receive a message about creating a file in [workspace folder]/.PVS-Studio/MSBuildAnalyzerConfig.json where you can set some analysis settings that are similar to the console version of the analyzer.

Here are the suggested options:
- Edit opens a newly created file, does not start the analysis;
- Continue runs the analysis with default parameters;
- Cancel cancels the analysis running.
In this file, you can set the files and parameters to be used in the analysis:
- suppress files (with *.suppress.json);
- configuration files (with *.pvsconfig);
- platform and build configuration;
- particular projects (.csproj and .vcxproj) and files (.cs, .cpp, etc.) for analysis;
- other settings (you can find more information about these settings in the file and in the documentation.
Note: if you run the analysis for specific files via the context menu or tab group menu of the editor, PVS-Studio analyzes only files included in the selected solution.
Moreover, if a project file (a file with the .csproj extension) occurs among the analyzed files, PVS-Studio runs the analysis for all supported code files in this project.
Analyzing Java projects
Note: for the extension to recognize your project in an opened directory, install and enable the "Project manager for Java" extension in VS Code.
By default, the extension looks for the analyzer core in one of the following directories:
- "C:\Users\[User]\AppData\Roaming\PVS-Studio-Java (on Windows)";
- "~/.config/PVS-Studio-Java (on Linux and macOS)".
If the core is located in a different folder, specify the path to it in the extension settings (File > Preferences > Settings > PVS-Studio: Java Projects Analyzer)
To run the analyzer core, the JDK version 11-19 is required. By default, it uses the JDK, the path to which is set in the environment variables. If your JDK version is not in the range of supported ones, install a supported JDK and specify the path to it in the VS Code settings (File > Preferences > Settings > PVS-Studio: Java For Running Analyzer).
Before starting the analysis, we recommend using the "Java: Reload Projects" command from the command palette (Ctrl + Shift + P). If a drop-down list of your project modules appears after that, make sure that all the modules that you want to analyze are ticked.
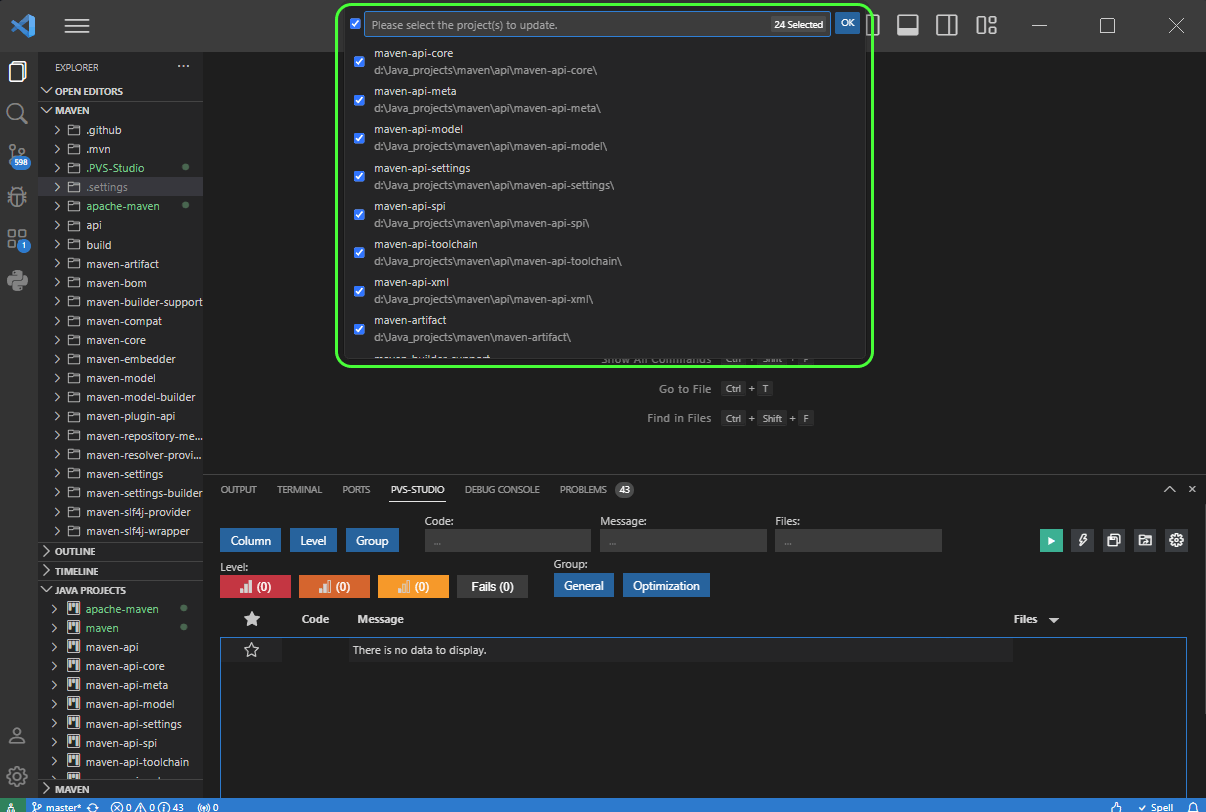
Running analysis
When analyzing a project for the first time, you will receive a notification that a file has been created in "[workspace folder]/.PVS-Studio/JavaAnalyzerConfig.json". In the file, you can configure some analysis settings similar to those in the console version of the analyzer.

The following options are available:
- the Edit button opens the newly created file, no analysis is run;
- the Continue button runs analysis with default parameters;
- the Cancel button cancels the start of analysis (the file will not be created).
In this file, you can specify the parameters that will be included in the analysis, for example:
- The path to a suppress file (with the *.json extension);
- Enable/disable incremental analysis (disabled by default);
- Enable/disable the V6078 diagnostic rule, which detects potential API compatibility issues between the selected Java SE versions (versions are specified as separate parameters).
Handling analysis results
Converting PVS-Studio report to JSON format
Note: the PVS-Studio extension for Visual Studio Code supports reports in JSON format only. Depending on the type of checked project and the method of running the analysis, PVS-Studio can generate a report in several formats. To display the report in the extension, you need to convert it to JSON format.
To convert it, you can use command-line utilities: PlogConverter.exe for Windows and plog-converter for Linux and macOS. These utilities allow not only to convert the PVS-Studio report to different formats but also to additionally process it. For example, to filter warnings. You can read more about this here.
Here's an example of a command used to convert the PVS-Studio report to JSON format with the help of PlogConverter.exe (Windows):
PlogConverter.exe path\to\report.plog -t json ^
                                      -n PVS-Studio
Here's an example of a command used to convert the PVS-Studio report to JSON format with the help of plog-converter (Linux and macOS):
plog-converter path/to/report/file.plog -t json \
                                        -o PVS-Studio.json
Viewing converted PVS-Studio report in VS Code
To view the report in Visual Studio Code, click 'Open report' on the PVS-Studio window and select the required file. You can also open the report by selecting 'PVS-Studio: Load Report' in the command palette (Ctrl+Shift+P).

After that, the warnings from the report will be displayed on the table:
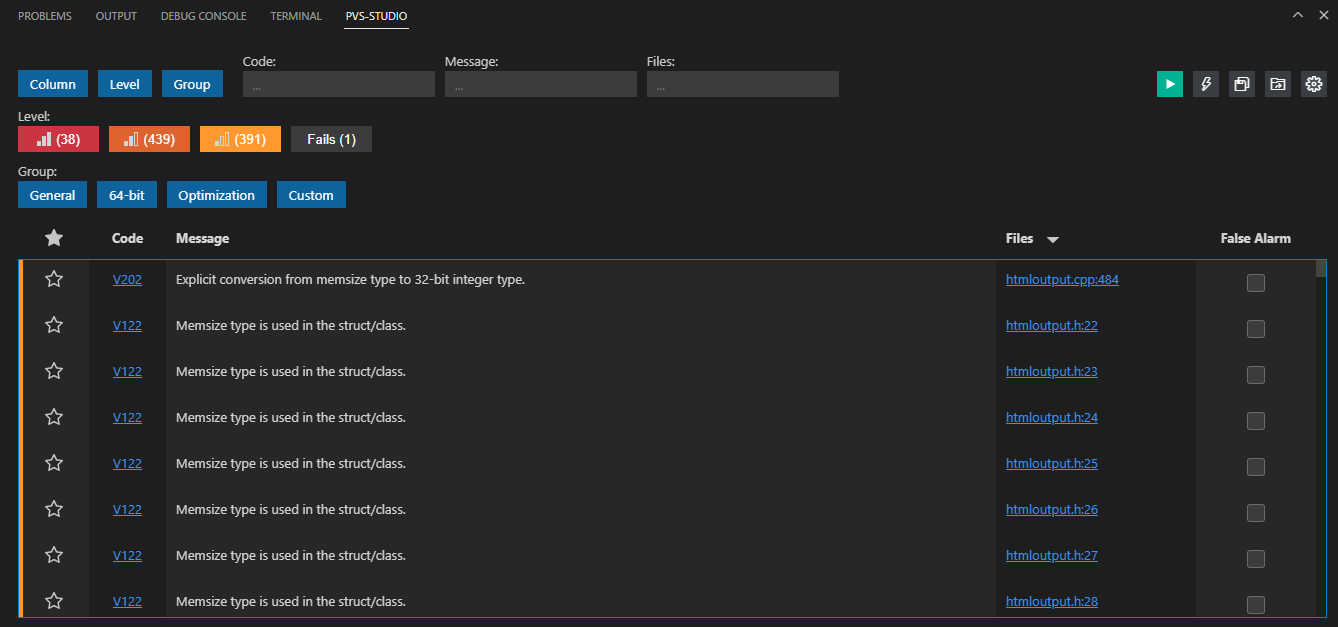
For convenient work with the table, attach it to the panel. To do this, right-click the panel header and select "Keep 'PVS-Studio'".

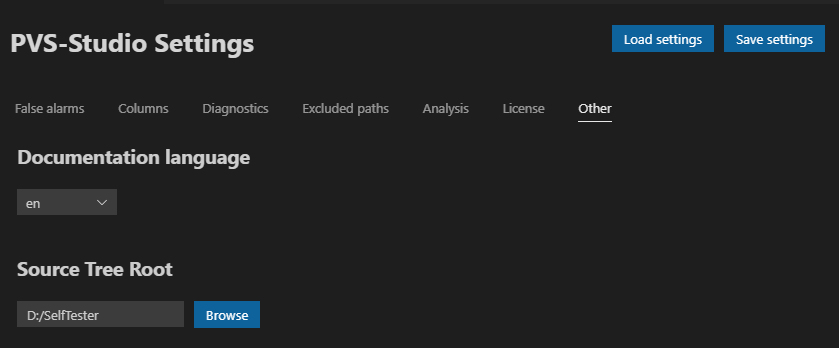
To handle a report containing relative paths, you need to use the 'Source Tree Root' setting. To do this, open the 'Settings' window, select the 'Other' tab, click 'Browse', and select the directory relative to which all paths in the report file will be expanded.
Filtering warnings
PVS-Studio output window filtering mechanisms allow to quickly find and display diagnostic messages. They can be displayed separately and in groups. The window tools include a number of buttons that allow to enable or disable the display of warnings from their corresponding groups.
All buttons can be divided into 3 groups: filters by the warnings' levels of certainty, message filters by diagnostic groups, filters by keywords. You can filter warnings by the message code, by the message text, and by the file containing the analyzer message.
You can find a detailed description of the levels of certainty and groups of diagnostic rules in the following documentation section: "Getting acquainted with the PVS-Studio static code analyzer on Windows".
To switch the visibility of the filtering group, use the 'Column', 'Level', 'Group' buttons.

You can combine all of these warning filtering mechanisms with each other. For example, you can filter messages by the level and groups of displayed warnings, or exclude messages marked as false alarms, etc.
How to suppress warnings
When you run the analyzer for the first time to check a large project, there may be a lot of warnings. We recommend you to note the most interesting ones and hide the rest using the warning suppression mechanism.
To suppress all warnings, click 'Suppress All Messages' at the top right of the window:
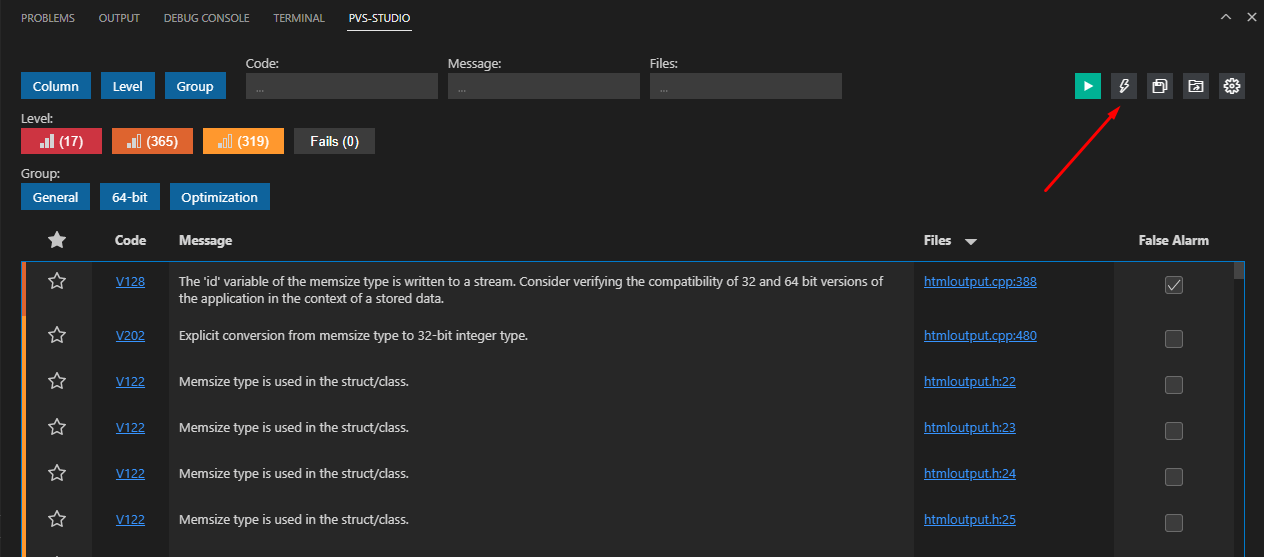
When you click it, an additional window will appear asking you which warning messages you would like to suppress:
- Suppress All suppresses all the warnings in the table (even those that are hidden with filters and settings);
- Suppress Filtered suppresses only those warnings that are currently in the table.
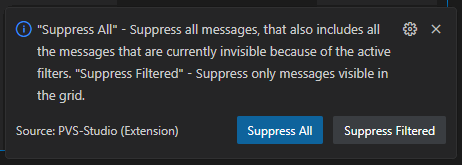
To suppress warnings to an existing suppression file, select the preferred option. If the warning suppression file is not found, it will be created in the following directory: '%root_directory_of_a_project's_ source_code%/.PVS-Studio'.
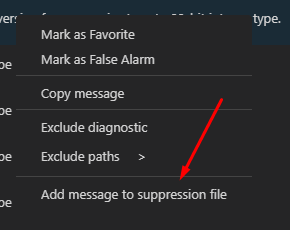
If the suggested option doesn't work for you, you can use targeted warning suppression. To do this, select the necessary rows in the table, open the context menu, and select 'Add message to suppression file'.
Navigation and sorting
The PVS-Studio output window is primarily designed for easier code navigation. It also simplifies jumping to code fragments containing potential errors. Double-clicking on any of the warnings in the list will automatically open the file for which the analyzer issued a message.
To mark interesting warnings, for example, those that you want to view later, you can use the "asterisk" in the corresponding column.
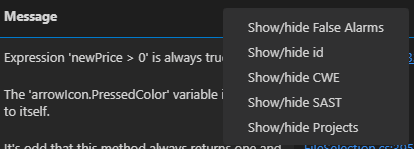
Right-clicking on the table header opens a context menu where you can customize the displayed columns.
Other features
The table supports multiple selection with the help of standard 'Ctrl' and 'Shift' combinations. The context menu of the table of warnings contains several items:
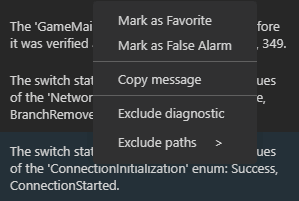
- Mark as Favorite marks selected messages as favorites;
- Mark as False Alarm marks selected messages as false alarms and adds a special comment to the source code;
- Copy message copies the diagnostic number, the warning message, and the file for which the warning is issued to the clipboard;
- Exclude diagnostic excludes the display of all warnings with the same diagnostic number as the highlighted one;
- Exclude paths allows to exclude the path to the selected file or a part of this path. All warnings issued for files containing the selected path will not be shown.

The buttons on the right side of the panel are designed to start the analysis, to suppress warnings, to save the report, to open a new report, to open the extension settings. If a report contains some changes, the save report button will become red, as shown in the screenshot below.

Plugin settings
To open the settings window, click on the rightmost button of the PVS-Studio window, or use 'Ctrl+Shift+P' and type 'PVS-Studio: Show Settings'.
The 'Save settings' button saves the settings in JSON format. To load the saved settings, use the 'Load settings' button.
False alarms
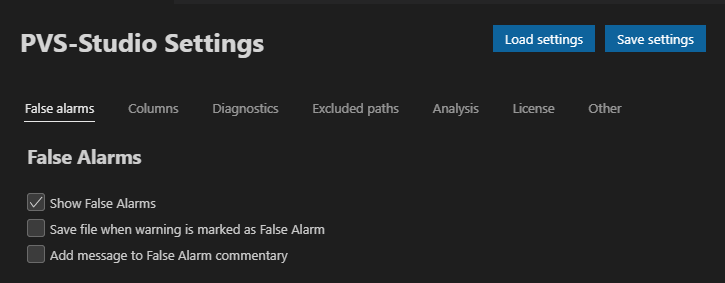
In the 'False Alarms' tab, you can select whether to:
- show False Alarms or not;
- save the source files automatically when the warning is marked as False Alarm;
- add an additional message to false alarm commentary.
Columns
This tab allows you to mark columns that should be displayed in the table of warnings.
Diagnostics
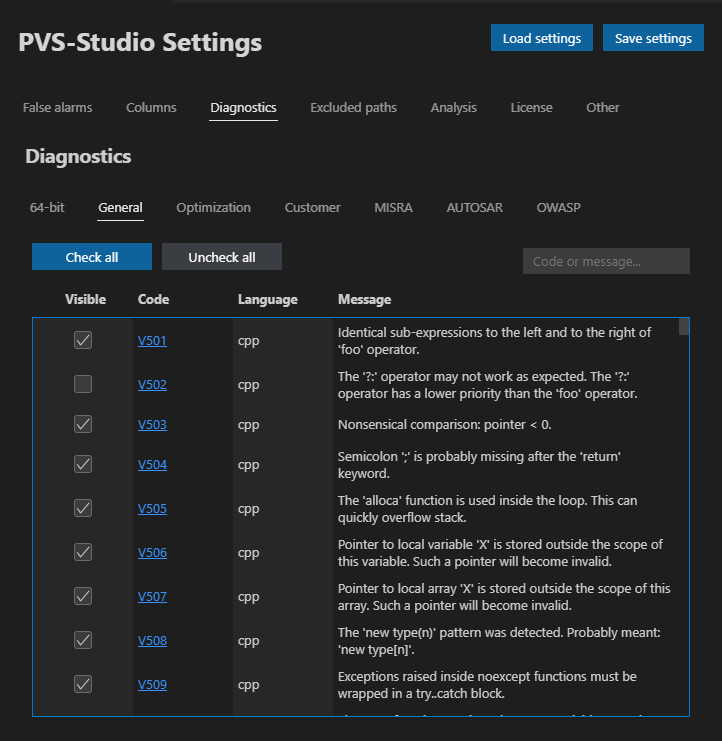
The 'Diagnostics' tab allows to mark the warnings that should be displayed in the table of warnings. All warnings are divided into groups. To search for a specific diagnostic rule, you can use the 'Code and Messages' field. 'Check all/Uncheck all' are designed to enable/disable the display of all diagnostic rules from a certain group. When disabling all diagnostic rules from the corresponding group, the button of this group is removed from the corresponding filtering group in the PVS-Studio window.
Exclude paths
The 'Exclude paths' tab allows to enter paths or path masks in the 'New excluded path' field. Messages issued for files that meet the mask conditions will not be displayed in the table of warnings.
Analysis
The 'Analysis' tab provides the 'Timeout' field where you can enter the time in seconds after which the analysis will be interrupted. In the 'Thread Count' field, you can enter the number of the analyzer core processes running in parallel that will be involved in the analysis.
License
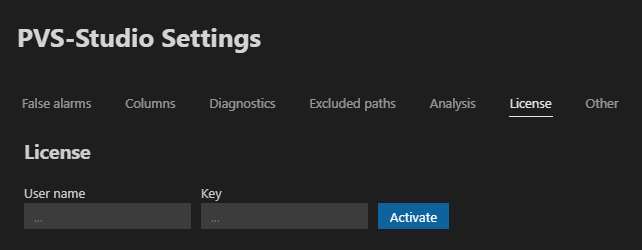
In the 'License' tab, you can enter the name and the key of your license. If you enter the valid data, you will see a message with the license data.
Other
Documentation language. The setting allows to set the language for the built-in documentation of PVS-Studio diagnostic rules available on our website.
This setting does not change the interface language of the PVS-Studio extension or the diagnostic messages issued by the analyzer.
Source Tree Root. To handle the PVS-Studio report containing relative file paths, you need to replace them with absolute ones. The setting allows to set the directory relative to which all paths in the report file are disclosed.
You can find a detailed description of using relative paths in the PVS-Studio report files here.


 Contents