Running PVS-Studio in Azure DevOps
Azure DevOps is a cloud platform that helps developers write and run applications, and stores data on remote servers. The platform contains the following tools: Azure Pipeline, Azure Board, Azure Artifacts, and others. They speed up development and improve code quality.
This documentation describes an example of the PVS-Studio integration for analyzing C# code. The commands to run PVS-Studio for analyzing C, C++ or Java code will be different. Please consult the following documentation sections: "Cross-platform analysis of C and C++ projects in PVS-Studio" and "Direct use of Java analyzer from command line".
In this tutorial we'll integrate analysis into a project's build.
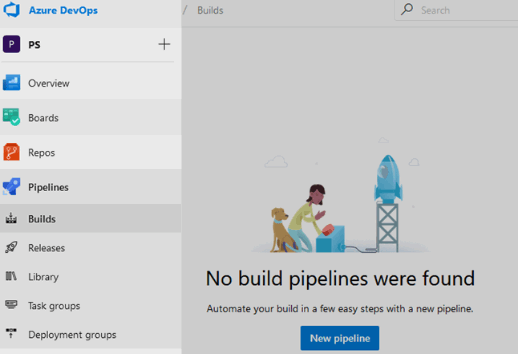
Go to 'Pipelines -> Builds' and create a new Build pipeline.
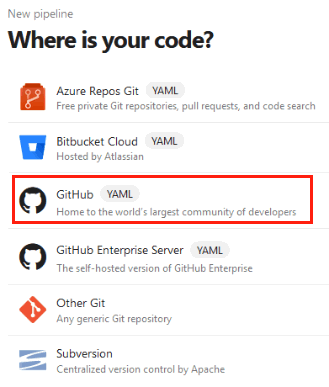
Specify the project's source. For example, GitHub.
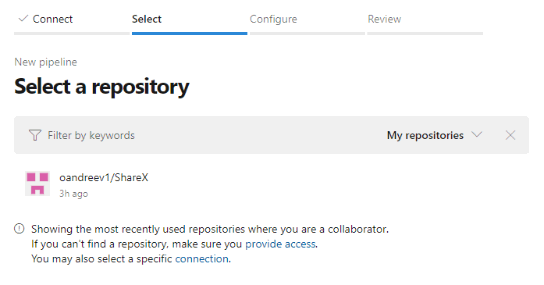
Authorize the Azure Pipelines application and specify the repository that contains the project.
Choose 'Starter pipeline' as the pipeline template.
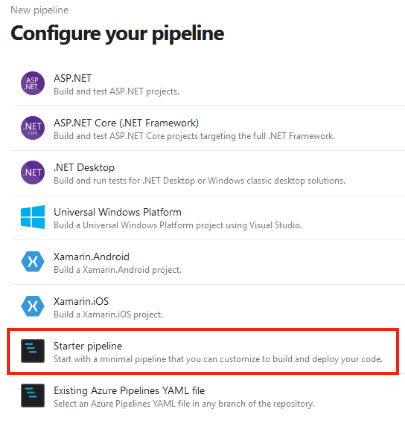
To run static code analysis, you can use a Microsoft-hosted or self-hosted agent.
Use a Microsoft-hosted agent
Microsoft-hosted agents are regular virtual machines. You can request one to run a Pipeline. The virtual machine is automatically discarded after the task is completed. These agents are convenient because you do not need to maintain or update them.
Replace the default build configuration with the following code:
# Configure launch triggers. Run only for changes in the master branch.
trigger:
- master

# Since virtual machines do not allow third-party software,
# run a Docker container
# on a Windows Server 1803 virtual machine.
pool:
  vmImage: 'win1803'
container: microsoft/dotnet-framework:4.7.2-sdk-windowsservercore-1803

steps:
# Download the analyzer distribution.
- task: PowerShell@2
  inputs:
    targetType: 'inline'
    script: 'Invoke-WebRequest
               -Uri https://files.pvs-studio.com/PVS-Studio_setup.exe
               -OutFile PVS-Studio_setup.exe'
- task: CmdLine@2
  inputs:
    workingDirectory: $(System.DefaultWorkingDirectory)
    script: |
# Restore the project and download dependencies.
      nuget restore .\ShareX.sln
# Create a directory for analyzer report files.
      md .\PVSTestResults
# Install the analyzer.
      PVS-Studio_setup.exe /VERYSILENT /SUPPRESSMSGBOXES
                           /NORESTART /COMPONENTS=Core
# Register license information.
      "C:\Program Files (x86)\PVS-Studio\PVS-Studio_Cmd.exe"
          credentials
          -u $(PVS_USERNAME)
          -n $(PVS_KEY)
# Run PVS-Studio analysis.
      "C:\Program Files (x86)\PVS-Studio\PVS-Studio_Cmd.exe"
         -t .\ShareX.sln
         -o .\PVSTestResults\ShareX.plog
# Convert the report to the html format.
      "C:\Program Files (x86)\PVS-Studio\PlogConverter.exe"
         -t html
         -o .\PVSTestResults\
         .\PVSTestResults\ShareX.plog
# Publish analyzer reports.
- task: PublishBuildArtifacts@1
  inputs:
    pathToPublish: PVSTestResults
    artifactName: PVSTestResults
Now add variables needed to create a license file. To do this, open the Pipeline editing window, and click 'Variables' in the upper-right corner.
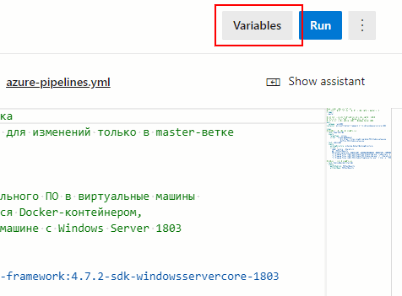
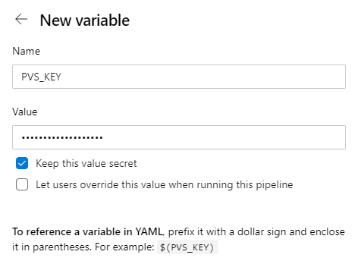
Add the 'PVS_USERNAME' and 'PVS_KEY' variables that the username and license key values. When creating the 'PVS_KEY' variable, check 'Keep this value secret'. This keeps the value encrypted and prevents it from showing up on the task execution log.
To analyze the project, click the 'Run' that starts the Pipeline.
Use a self-hosted agent
A second way to run analysis is to use a self-hosted agent. Self-hosted agents are agents you configure and manage on your own. Such agents support more software you may need to build and test a project.
Before you can use these agents for static analysis, configure them as the instructions say, and then install and configure the static analyzer.
To run tasks on self-hosted agents, replace the default configuration with the following code:
# Configure launch triggers. Master branch analysis.
trigger:
- master

# Set tasks to run on a self-hosted agent selected from the 'MyPool' pool.
pool: 'MyPool'

steps:
- task: CmdLine@2
  inputs:
    workingDirectory: $(System.DefaultWorkingDirectory)
    script: |
# Restore the project and download dependencies.
      nuget restore .\ShareX.sln
# Create a directory for analysis report files
      md .\PVSTestResults
# Run PVS-Studio analysis.
      "C:\Program Files (x86)\PVS-Studio\PVS-Studio_Cmd.exe"
         -t .\ShareX.sln
         -o .\PVSTestResults\ShareX.plog
# Convert the report to the html format.
      "C:\Program Files (x86)\PVS-Studio\PlogConverter.exe"
         -t html
         -o .\PVSTestResults\
         .\PVSTestResults\ShareX.plog
# Publish analyzer reports.
- task: PublishBuildArtifacts@1
  inputs:
    pathToPublish: PVSTestResults
    artifactName: PVSTestResults
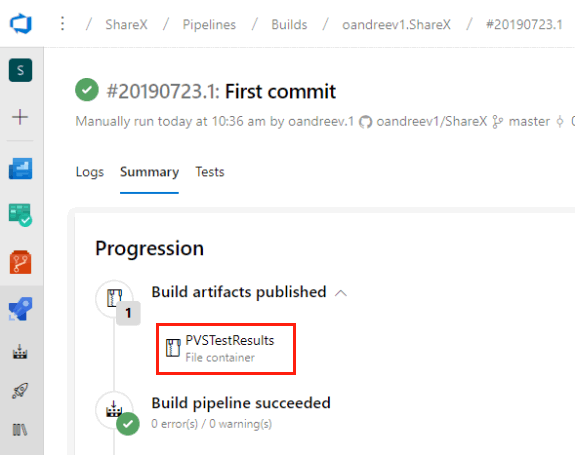
After the task is completed, you can download an archive with reports from the 'Summary' tab. Alternatively, you can get reports by email. Use the Send Mail tool to configure email settings.
Additional features
Completing a run with a failure
If you want the build step to stop and return an error message if there are analyzer warnings, you can use the PlogConverter utility. With PlogConverter utility you can set a warning level at which the run will stop. An example of the code fragment to set the stop step to the end of the configuration:
- task : PowerShell@2
  inputs:
    targetType: 'inline'
    script:  |
    & "C:\Program Files (x86)\PVS-Studio\PlogConverter.exe" -t json -a GA:1
-o .\PVSTestResults\  .\PVSTestResults\TestTask.plog
--indicateWarnings  --noHelpMessages
    IF ($LASTEXITCODE -eq 0)  {exit 0} ELSE {Write-Host
"##vso[task.logissue type=error]Analysis log contains High level warnings.";
 Write-Host "##vso[task.complete result=Failed;]"; exit 0 }
Use the --analyzer (-a) flag of the PlogConverter utility to change the type of warnings the task will respond to.
Viewing analysis results
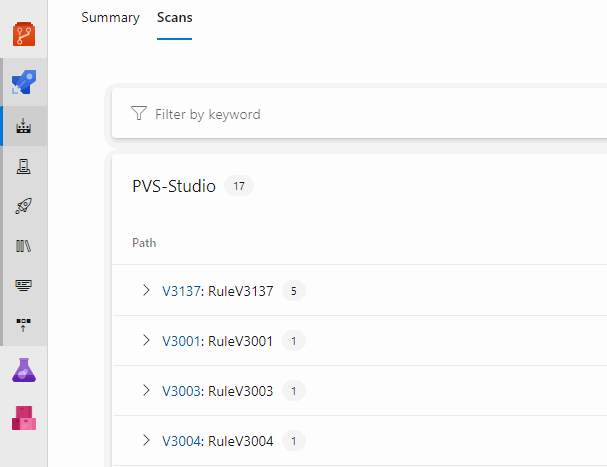
You can use the SARIF SAST Scans Tab extension to view the analyzer's report on the run results page.
To convert a report to the SARIF format and use the extension, add the following steps:
- task: CmdLine@2
  inputs:
    workingDirectory: $(System.DefaultWorkingDirectory)
    script: "C:\Program Files (x86)\PVS-Studio\PlogConverter.exe" -t sarif
-o .\PVSTestResults\  .\PVSTestResults\TestTask.plog

- task: PublishBuildArtifacts@1
  inputs:
    PathtoPublish: .\PVSTestResults\TestTask.plog.sarif
    ArtifactName: CodeAnalysisLogs
After completing the pipeline, the analyzer's report will be added to the run result page in the Scans tab.
