Viewing analysis results with C and C++ Compiler Monitoring UI
- Introduction
- Analyzing source files with the help of the compiler process monitoring system
- Incremental analysis when using compiler monitoring system
- Working with the list of diagnostic messages
- Navigation and search in the source code
Introduction
PVS-Studio can be used independently from the Visual Studio IDE. The core of the analyzer is a command-line utility allowing analysis of C/C++ files that can be compiled by Visual C++, GCC, or Clang. For this reason, we developed a standalone application implemented as a shell for the command-line utility and simplifying the work with the analyzer-generated message log.
PVS-Studio provides a convenient plug-in for the Visual Studio environment, allowing "one-click" analysis of this IDE's vcproj/vcxproj-projects. There are, however, a few other build systems out there which we also should provide support for. Although PVS-Studio's analyzer core doesn't depend on any particular format used by this or that build system (such as, for example, MSBuild, GNU Make, NMake, CMake, ninja, and so on), the users would have to carry out a few steps on their own to be able to integrate PVS-Studio's static analysis into a build system other than VCBuild/MSBuild projects supported by Visual Studio. These steps are as follows:
- First, the user would need to integrate a call to PVS-Studio.exe directly into the build script (if available) of a particular system. Otherwise, the user will need to modify the build system itself. To learn more about it, read this documentation section. It should be noted right off that this way of using the analyzer is not always convenient or even plausible as the user is not always permitted to modify the build script of the project they are currently working with.
- After PVS-Studio's static analysis has been integrated into the build system, the user needs to somehow view and analyze the analyzer's output. This, in its turn, may require creating a special utility to convert the analyzer's log into a format convenient for the user. Note that when you have Visual Studio installed, you can at any time use the PVS-Studio plug-in for this IDE to view the report generated by the analyzer's core.
- Finally, when the analyzer finds genuine bugs in the code, the user needs a functionality enabling them to fix those bugs in the source files of the project under analysis.
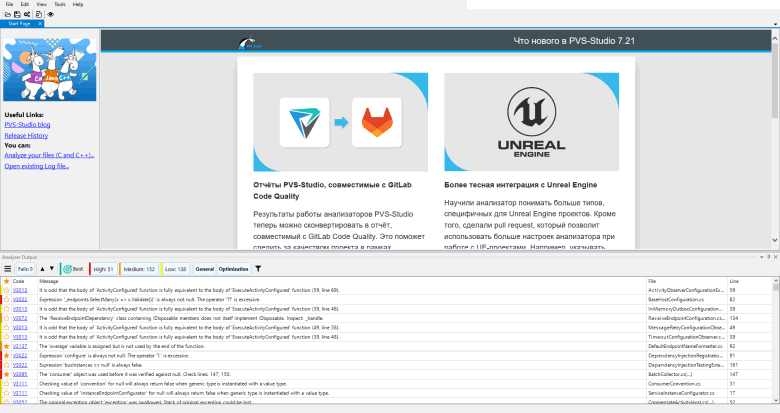
All these issues can be resolved by using the C and C++ Compiler Monitoring UI (Standalone.exe).
Figure 1 - Compiler Monitoring UI
Compiler Monitoring UI enables "seamless" code analysis regardless of the compiler or build system one is using, and then allows you to work with the analysis results through a user interface similar to that implemented in the PVS-Studio plug-in for Visual Studio. The Compiler Monitoring UI also allows the user to work with the analyzer's log obtained through direct integration of the tool into the build system when there is no Visual Studio installed. These features are discussed below.
Analyzing source files with the help of the compiler process monitoring system
Compiler Monitoring UI provides a user interface for a compilation monitoring system. The monitoring system itself (the console utility CLMonitor.exe) can be used independently of the Compiler Monitoring UI - for example when you need to integrate static analysis into an automated build system. To learn more about the use of the compiler monitoring system, see this documentation section.
To start monitoring compiler invocations, open the corresponding dialog: Tools -> Analyze Your Files... (Figure 2):
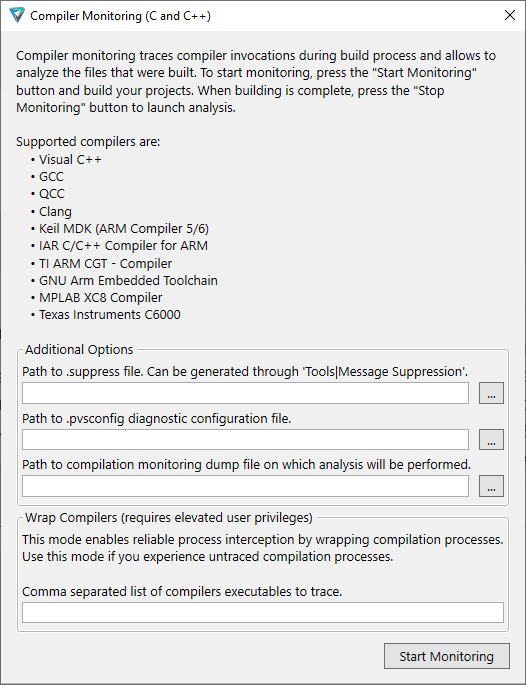
Figure 2 - Build process monitoring start dialog
Click on "Start Monitoring". After that, CLMonitor.exe will be called while the main window of the tool will be minimized.
Run the build and after it is finished, click on the "Stop Monitoring" button in the window in the bottom right corner of the screen (Figure 3):

Figure 3 - Compiler monitoring dialog
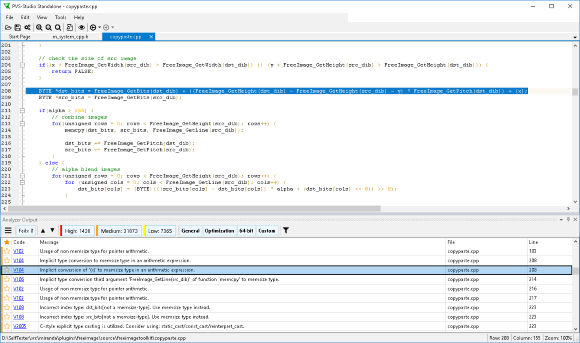
If the monitoring server has successfully tracked the compiler invocations, static analysis will be launched for the source files. When it is finished, you will get a regular PVS-Studio's analysis report (Figure 4):
Figure 4 - Results of the monitoring server's and static analyzer's work
The analysis results can be saved into an XML file (with the plog extension) for further use through the menu command 'File -> Save PVS-Studio Log As...'.
Incremental analysis when using compiler monitoring system
The way of performing incremental analysis is the same as the process of the analyzing the whole project. The key difference is the need to implement not a full, but an incremental build of the project. In such a case compilers runs for modified files will be monitored that will allow to check only them. The rest of the analysis process is completely identical to the described above, in the section "Analyzing source files with the help of the compiler process monitoring system".
Working with the list of diagnostic messages
Once you have got the analysis report with the analyzer-generated warnings, you can start viewing the messages and fixing the code. You can also load a report obtained earlier into the Compiler Monitoring UI. To do this, use the menu command 'File|Open PVS-Studio Log...'.
Various message suppression and filtering mechanisms available in this utility are identical to those employed in the Visual Studio plug-in and are available in the settings window 'Tools|Options...' (Figure 5).
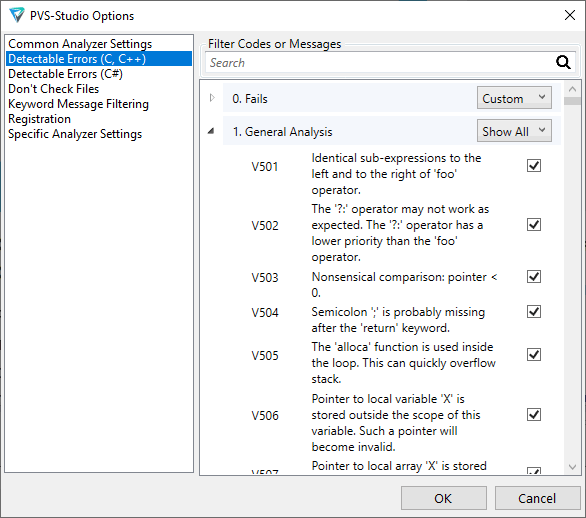
Figure 5 - Analysis settings and message filtering mechanisms
In the Analyzer Output window, you can navigate through the analyzer's warnings, mark messages as false positives, and add filters for messages. The message handling interface in the Compiler Monitoring UI is identical to that of the output window in the Visual Studio plug-in. To see a detailed description of the message output window, see this documentation section.
If you are new to the static analysis tool and would like to know what it can do, you can use the Best Warnings mechanism. This mechanism will show you the most important and reliable warnings.
To check out the analyzer's most interesting warnings, click on the 'Best' button, as shown in the screenshot below:

After that, the table with the results of the analysis will show maximum of ten of the most critical warnings of the analyzer.
Navigation and search in the source code
Although the built-in editor of the Compiler Monitoring UI does not provide a navigation and autocomplete system as powerful and comfortable as Microsoft IntelliSense in the Visual Studio environment or other similar systems, Compiler Monitoring UI still offers several search mechanisms that can simplify your work with the analysis results.
Besides regular text search in a currently opened file (Ctrl + F), Compiler Monitoring UI also offers the Code Search dialog for text search in opened files and folders of the file system. This dialog can be accessed through the menu command 'Edit|Find & Replace|Search in Source Files...' (Figure 6):
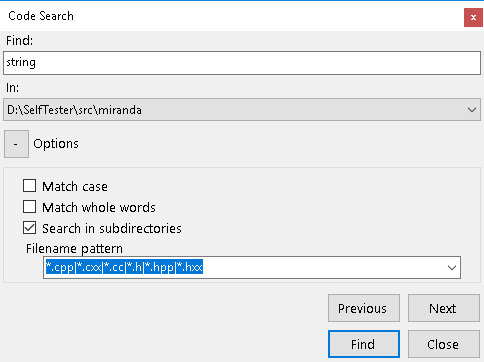
Figure 6 - Search dialog of Compiler Monitoring UI
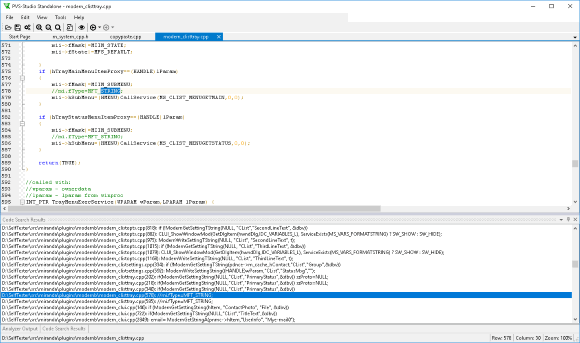
The dialog supports search in the current file, all of the currently opened files, or any folder of the file system. You can at any moment stop the search by clicking on the Cancel button in the modal window that will show up after the search starts. Once the first match is found, the results will start to be output right away into the child window Code Search Results (Figure 7):
Figure 7 - Results of text search in project source files
Of course, regular text search may be inconvenient or long when you need to find some identifier's or macro's declarations and/or uses. In this case, you can use the mechanism of dependency search and navigation through #include macros.
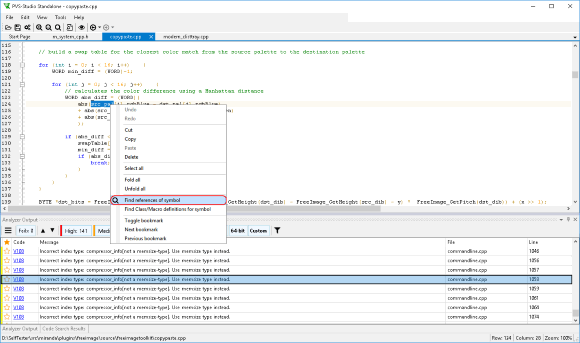
Dependency search in files allows you to search for a character/macro in those particular files that directly participated in compilation, or to be more exact, in the follow-up preprocessing when being checked by the analyzer. To run the dependency search, click on the character whose uses you want to find to open the context menu (Figure 8):
Figure 8 - Dependency search for a character
The search results, just like with the text search, will be output into a separate child window: 'Find Symbol Results'. You can at any moment stop the search by clicking on the Cancel button in the status bar of the Compiler Monitoring UI main window, near the progress indicator.
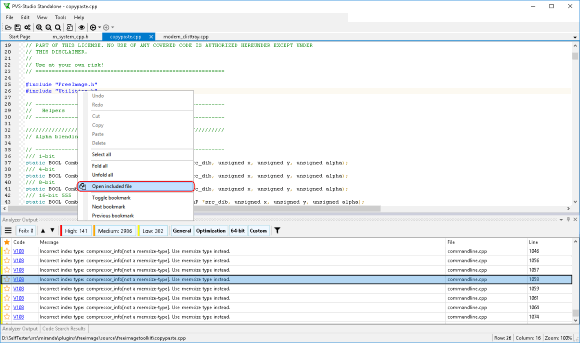
Navigation through the #include macros allows you to open in the Compiler Monitoring UI code editor files added into the current file through such a macro. To open an include macro, you also need to use the editor's context menu (Figure 9):
Figure 9 - Navigation through include macros
Keep in mind that information about dependencies is not available for every source file opened in Compiler Monitoring UI. When the dependencies base is not available for the utility, the above mentioned context menu items will be inactive, too.
The dependencies base is created only when analysis is run directly from the Compiler Monitoring UI itself. When opening a random C/C++ source file, the utility won't have this information. Note that when saving the analyzer's output as a plog file, this output having been obtained in the Compiler Monitoring UI itself, a special dpn file, associated with the plog file and containing dependencies of the analyzed files, will be created in the same folder. While present near the plog file, the dpn file enables the dependency search when viewing the plog file in the Compiler Monitoring UI.

