Recently PVS-Studio has implemented a major feature—we supported intermodular analysis of C++ projects. This article covers our and other tools' implementations. You'll also find out how to try this feature and what we managed to detect using it.
Why would we need intermodular analysis? How does the analyzer benefit from it? Normally, our tool is checking only one source file at a time. The analyzer doesn't know about the contents of other project files. Intermodular analysis allows us to provide the analyzer with information about the entire project structure. This way, the analysis becomes more accurate and qualitative. This approach is similar to the link time optimization (LTO). For example, the analyzer can learn about a function behavior from another project file and issue a warning. It may be, for instance, dereference of a null pointer that was passed as an argument to an external function.
Implementation of intermodular analysis is a challenging task. Why? To find out the answer to this question, let's first dig into the structure of C++ projects.
Before the C++20 standard, only one compilation scenario was adopted in the language. Typically program code is shared among header and source files. Let's look through the stages of this process.
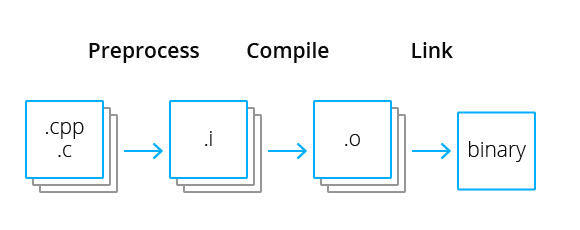
The advantage of this approach is parallelism. Each source file can be translated in a separate thread, which considerably saves time. However, for static analysis, this feature creates problems. Or, rather, it all works well as long as one specific translation unit is analyzed. The intermediate representation is built as an abstract syntax tree or a parse tree; it contains a relevant symbol table for current module. You can then work with it and run various diagnostics. As for symbols defined in other modules (in our case, other translation units), the information is not enough to draw conclusions about them. So, it is collecting this information that we understand by "intermodular analysis" term.
A noteworthy detail is that the C++20 standard made changes in the compilation pipeline. This involves new modules that reduce project compilation time. This topic is another pain in the neck and discussion point for C++ tools developers. At the time of writing this article, build systems don't fully support this feature. For this reason, let's stick with the classic compilation method.
One of the most popular tools in the world of translators is LLVM—a set of tools for compiler creation and code handling. Many compilers for languages such as C/C++ (Clang), Rust, Haskel, Fortran, Swift and many others are built based on it. It became possible because LLVM intermediate representation doesn't relate to a specific programming language or platform. Intermodular analysis in LLVM is performed on intermediate representation during link time optimization (LTO). The LLVM documentation describes four LTO stages:
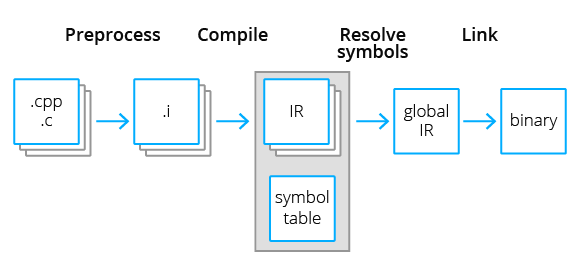
Static analysis does not need all listed LTO stages—it does not have to make any optimizations. The first two stages would be enough to collect the information about symbols and perform the analysis itself.
We should also mention GCC - the second popular compiler for C/C++ languages. It also provides link time optimizations. Yet they are implemented slightly differently.
In addition, GCC supports a mode called WHOPR. In this mode, object files link by parts based on the call graph. This lets the second stage run in parallel. As a result, we can avoid loading the entire program into memory.
We can't apply the approach above to the PVS-Studio tool. Our analyzer's main difference from compilers is that it doesn't form intermediate representation that is abstracted from the language context. Therefore, to read a symbol from another module, the tool has to translate it again and represent a program as in-memory data structures (parse tree, control flow graph, etc). Data flow analysis may also require parsing the entire dependency graph by symbols in different modules. Such a task may take a long time. So, we collect information about symbols (in particular in data flow analysis) using semantic analysis. We need to somehow save this data separately beforehand. Such information is a set of facts for a particular symbol. We developed the below approach based on this idea.
Here are three stages of intermodular analysis in PVS-Studio:
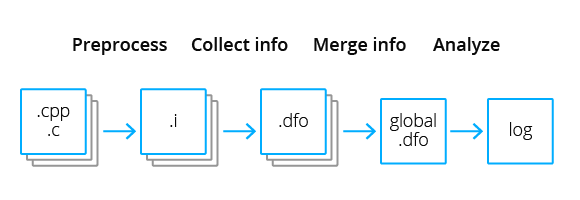
Unfortunately, part of the information gets lost in this implementation. Here's the reason. Data flow analysis may require information on dependencies between modules to evaluate virtual values (possible ranges/sets of values). But there is no way to provide this information because each module is traversed only once. To solve this problem, it would require a preliminary analysis of a function call. This is what GCC does (call graph). However, these constraints complicate the implementation of incremental intermodular analysis.
You can run intermodular analysis on all three platforms we support. Important note: intermodular analysis currently doesn't work with these modes: running analysis of a files list; incremental analysis mode.
The pvs-studio-analyzer helps analyze projects on Linux/macOS. To enable the intermodular analysis mode, add the --intermodular flag to the pvs-studio-analyzer analyze command. This way the analyzer generates the report and deletes all temporary files itself.
Plugins for IDE also support intermodular analysis that is available in JetBrains CLion IDE on Linux and macOS. Tick the appropriate check box in the plugin settings to enable intermodular analysis.
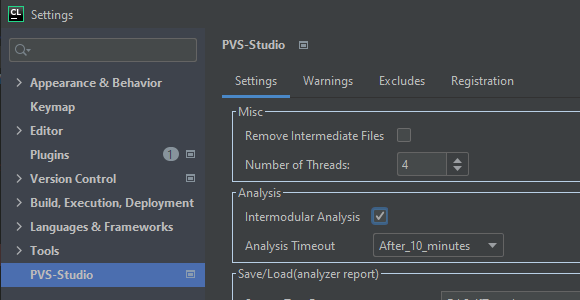
Important: if you tick IntermodularAnalysis with enabled incremental analysis, the plugin will report an error. Another notice. Run the analysis on the entire project. Otherwise, if you run the analysis on a certain list of files, the result will be incomplete. The analyzer will notify you about this in the warning window: V013: "Intermodular analysis may be incomplete, as it is not run on all source files". The plugin also syncs its settings with the global Settings.xml file. This allows you to set same settings for all IDEs where you integrated PVS-Studio. Therefore, you can manually enable incompatible settings in it. When you try to run the analysis, the plugin reports an error in the warning window: "Error: Flags --incremental and --intermodular cannot be used together".
You can run the analysis on Windows in two ways: via PVS-Studio_Cmd and CLMonitor console utilities, or via the plugin.
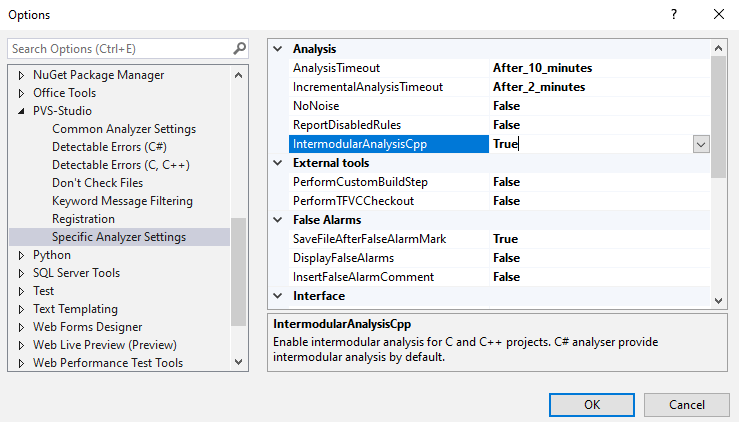
To run the analysis via the PVS-Studio_Cmd / CLMonitor utilities, set true for the <IntermodularAnalysisCpp> tag in the Settings.xml config.
This option enables intermodular analysis in the Visual Studio plugin:
Sure, after we implemented intermodular analysis, we got interested in new errors that we now can find in projects from our test base.
V522 Dereferencing of the null pointer might take place. The null pointer is passed into '_tr_stored_block' function. Inspect the second argument. Check lines: 'trees.c:873', 'deflate.c:1690'.
// trees.c
void ZLIB_INTERNAL _tr_stored_block(s, buf, stored_len, last)
    deflate_state *s;
    charf *buf;       /* input block */
    ulg stored_len;   /* length of input block */
    int last;         /* one if this is the last block for a file */
{
    // ....
    zmemcpy(s->pending_buf + s->pending, (Bytef *)buf, stored_len);      // <=
    // ....
}

// deflate.c
local block_state deflate_stored(s, flush)
    deflate_state *s;
    int flush;
{
    ....
    /* Make a dummy stored block in pending to get the header bytes,
     * including any pending bits. This also updates the debugging counts.
     */
    last = flush == Z_FINISH && len == left + s->strm->avail_in ? 1 : 0;
    _tr_stored_block(s, (char *)0, 0L, last);                            // <=
    ....
}
The null pointer (char*)0 gets into memcpy as the second argument via the _tr_stored_block function. It looks like there is no real problem—zero bytes are copied. But the standard clearly states the opposite. When we call functions like memcpy, pointers must point to valid data, even if the quantity is zero. Otherwise, we have to deal with undefined behavior.
The error has been fixed in the develop-branch, but not in the release version. It's been 4 years since the project team released updates. Initially, the error was found by sanitizers.
V774 The 'w' pointer was used after the memory was released. editcmd.c 2258
// editcmd.c
gboolean
edit_close_cmd (WEdit * edit)
{
    // ....
    Widget *w = WIDGET (edit);
    WGroup *g = w->owner;
    if (edit->locked != 0)
        unlock_file (edit->filename_vpath);
    group_remove_widget (w);
    widget_destroy (w);                          // <=
    if (edit_widget_is_editor (CONST_WIDGET (g->current->data)))
        edit = (WEdit *) (g->current->data);
    else
    {
        edit = find_editor (DIALOG (g));
        if (edit != NULL)
            widget_select (w);                   // <=
    }
}
// widget-common.c
void
widget_destroy (Widget * w)
{
    send_message (w, NULL, MSG_DESTROY, 0, NULL);
    g_free (w);
}
void
widget_select (Widget * w)
{
    WGroup *g;
    if (!widget_get_options (w, WOP_SELECTABLE))
        return;
    // ....
}
// widget-common.h
static inline gboolean
widget_get_options (const Widget * w, widget_options_t options)
{
    return ((w->options & options) == options);
}
The widget_destroy function frees memory by pointer, making it invalid. But after the call, widget_select receives the pointer. Then it gets to widget_get_options, where this pointer gets dereferenced.
The original Widget *w is taken from the edit parameter. But before calling widget_select, find_editor is called—it intercepts the passed parameter. The w variable is most likely used only to optimize and simplify the code. Therefore, the fixed call will look like widget_select(WIDGET(edit)).
The error is in the master branch.
V597 The compiler could delete the 'memset' function call, which is used to flush 'current' object. The memset_s() function should be used to erase the private data. args.c 269
Here's an interesting case with deleting memset:
// args.c
extern void eFree (void *const ptr);

extern void argDelete (Arguments* const current)
{
  Assert (current != NULL);
  if (current->type ==  ARG_STRING  &&  current->item != NULL)
    eFree (current->item);
  memset (current, 0, sizeof (Arguments));  // <=
  eFree (current);                          // <=
}

// routines.c
extern void eFree (void *const ptr)
{
  Assert (ptr != NULL);
  free (ptr);
}
LTO optimizations may delete the memset call. It is because the compiler can figure out that eFree doesn't calculate any useful pointer-related data—eFree only calls the free function that frees memory. Without LTO, the eFree call looks like an unknown external function, so memset will remain.
Intermodular analysis opens up many previously unavailable opportunities for the analyzer to find errors in C, C++ programs. Now the analyzer addresses information from all files in the project. With more data on program behavior the analyzer can detect more bugs.
You can try the new mode now. It is available starting with PVS-Studio v7.14. Go to our website and download it. Please note that when you request a trial using the given link, you receive an extended trial license. If you have any questions, don't hesitate to write us. We hope this mode will be useful in fixing bugs in your project.

0