PVS-Studio provides static analyzers for C, C++, C# and Java languages on Windows, Linux and macOS platforms. PVS-Studio analyzers can vary slightly due to certain features that the languages have. However, all our analyzers share common technologies and approaches to the implementation of static analysis.

As part of PVS-Studio, there are 3 separate software tools for static code analysis:
The analyzers listed implement algorithms and mechanisms to run data-flow analysis (including symbolic execution and interprocedural analysis). These algorithms and mechanisms are built upon PVS-Studio's own developments.
Let's look at the approaches and processes upon which the work of the PVS-Studio static code analyzer is based.
First, let's look at two terms that we use from the theory of developing compilers and static code analyzers.
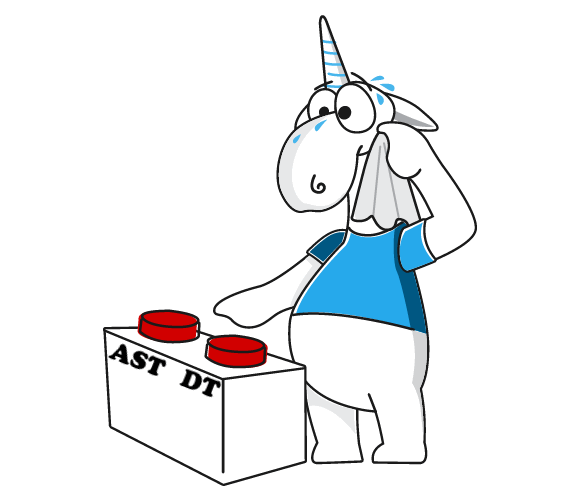
Abstract Syntax Tree (AST) is a finite oriented tree the nodes of which are correlated with the programming language's operators, and the leaves - with the corresponding operands. Compilers and interpreters use abstract syntax tree as an intermediate representation between parse trees and the internal code representation. The advantage of AST - sufficient structure compactness (abstractness). It is achieved due to the absence of nodes for constructs that do not affect semantics of the program.
AST-based analyzers do not depend on specific syntax. For example, names, coding style, code formatting, etc. This is the key advantage of the abstract syntax tree in comparison with direct analysis of program text (source code).
Parse Tree (PT, DT). The result of grammatical analysis. The parse tree differs from the abstract syntactical tree in that it contains nodes for those syntactic rules which do not influence the program semantics. A classic example of such nodes is grouping parentheses, while grouping of operands in AST is explicitly defined by the tree structure.

At a high level, we can say that the cores of all PVS-Studio analyzers for different languages work with an abstract syntax tree (AST). However, in practice, everything is a bit more complicated. In some cases, diagnostic rules require information about optional nodes or even about the number of spaces at the beginning of the line. In this case, the analysis proceeds down the parse tree and extracts additional information. All the parse libraries that we use (Roslyn, Spoon, VivaCore) enable getting information at the parse tree level. The analyzer takes this opportunity in some cases.
PVS-Studio analyzers use the AST program representation to search for potential defects by pattern-based analysis. It's a category of relatively simple diagnostic rules. To decide whether the code is dangerous, these rules compare the constructions in the code with predefined templates of potential errors. This approach to the analysis is accurate, but it allows you to find only relatively simple defects. For more complex diagnostic rules, PVS-Studio complements the AST analysis with other methods. We will look at these methods a little later.
Note that the template search is a more efficient technology than regular expressions. Regular expressions are actually not suitable to build an effective static analyzer, for many reasons. We can explain this with a simple example. Let's say you need to find typos when the expression is compared with itself. For the simplest cases, you can use regular expressions:
if (A + B == A + B)
if (V[i] == V[i])
However, if the expressions that contains errors are written a little differently, regular expressions are powerless. Rather, it is simply impossible to write them for all of the alternatives:
if (A + B == B + A)
if (A + (B) == (B) + A)
if (V[i] == ((V[i])))
if (V[(i)] == (V[i]))
In turn, in pattern matching, it's not a problem to detect such errors if you use an AST.
Note. Check out our collection of error examples. Notice how differently may look like such defects found by V501 (C, C++), V3001 (C#), V6001 (Java) diagnostics.
The abstract syntax tree representation of code is also a preparation step for the next level of analysis — the construction of a semantic model and type inference.
In addition to the syntax analysis of the code, all PVS-Studio analyzers also perform semantic analysis based on the use of AST code representation described in the previous step. They build a complete semantic model of the code they check.

The generalized semantic model is a dictionary of correspondences of semantic symbols and elements of the syntactic representation of the same code.
Each such symbol defines the semantics of the corresponding syntactic language construction. This semantics may be subtle and cannot be deduced from the local syntax itself. To derive such semantics, you must refer to other parts of the syntactic code representation. Here is an example of a code fragment in C language:
A = B(C);We don't know what B stands for, so it's impossible to say what kind of language construction this is. This can be either a function call or a functional cast expression.
The semantic model thus allows to analyze the code semantics. Without semantic model, we would have to constantly traverse the syntactic representation of this code to resolve semantic facts that are not deduced from the local context. During analysis, the semantic model "remembers" the semantics of code for further use. Here is an example:
void B(int);
....
A = B(C);
Encountering the declaration of the B function, the analyzer remember that the B symbol is the name of a function with certain characteristics. Encountering the A = B(C) expression, the analyzer immediately understands what B is. The analyzer does not need to traverse the large AST fragment again.
Based on the semantic model, PVS-Studio analyzers can perform type inference for any syntactic construction they encounter. For instance, such as variable identifiers, expressions, etc.
Most diagnostics require information about the types. Information about the types is necessary both to detect potential errors or to avoid false positives.
Even if we are talking about pattern-based analysis diagnostics - many of them take into account types. For example, in cases where a single syntactic representation is not enough to decide whether the tested construction is dangerous.
By way of example, here is a very simple V772 diagnostic for C++ code:
void *ptr = new Example();
....
delete ptr;
Calling a delete operator for a (void *) pointer causes undefined behavior. The search pattern itself is extremely simple: it is any call to the delete operator. We can say that this is a degenerate case of pattern-based diagnostic :). However, to understand whether an error was found or not, you need to know the type of the ptr operand.
Building a complete and correct semantic model requires consistency and, accordingly, compilability of the code we check. The compilability of the source code is a necessary condition for PVS-Studio analyzers to operate fully and correctly. PVS-Studio analyzers have fault tolerance mechanisms in cases when they deal with uncompilable code. However, the uncompilable code may impair the accuracy of diagnostic rules.
Preprocessing of C and C++ code is the mechanism that expands compilation directives in the source code and substitute the macro values. In particular, the result of the preprocessor operation is the following. In place of #include directives the contents of header files are substituted, the paths to which are specified by the directive. In the case of such substitution, the preprocessor expands directives and macros sequentially in all the header files that were already expanded by the #include directive.
Preprocessing is the first step of the compiler's work. It's a preparation of a compilation unit and its dependencies for source code translation into the internal compiler representation.

Expansion of #include directives leads to the merger of the source file and all the header files used in it into a single file, often called intermediate. By analogy with the compiler, C and C ++ PVS-Studio analyzer uses preprocessing before it starts the analysis.
PVS-Studio uses the target compiler (in preprocessor mode) for preprocessing the checked code. The analyzed code was originally intended to be built by the compiler used by PVS-Studio. PVS-Studio supports large number of preprocessors, which are listed on the product page. For the analyzer to work correctly, it is necessary to use the right preprocessor that corresponds to the compiler which is used to build the code. This is because the output format of the preprocessors of various compilers differs.
Before starting the C and C++ analysis, the PVS-Studio analyzer launches a preprocessor for each translation unit of the code it checks. Both contents of the source files and the compilation parameters affect the preprocessor operation. For preprocessing PVS-Studio uses the same build parameters that are used during code compilation. PVS-Studio receives information about the list of translation units and compilation parameters from the build system of the checked project, or by tracing (intercepting) compiler's calls during the project build.
The work of the PVS-Studio C and C ++ analyzer is based on the result of the work of the corresponding preprocessor. The analyzer does not analyze the source code directly. Preprocessing C and C ++ code by expanding compiler directives allows the analyzer to build a complete semantic model of the code being checked
However, there's one small detail. The phrase "the analyzer does not analyze the source code directly." should be read as "almost always the analyzer does not analyze the source code directly.". There are several diagnostics, such as V1040, that access the source code files directly. Such diagnostics require information about #include directives and macros. The information is lost after preprocessing.
PVS-Studio provides the monitoring feature that allows you to intercept process invocations at the level of your operating system's API. Intercepting a process being invoked allows to get complete information about this process: its invocation parameters and its working environment. PVS-Studio supports process invocation monitoring on Windows and Linux. The analyzer's Windows version uses WinAPI directly, while the Linux version employs the strace standard system utility.

The C and C++ PVS-Studio analyzers can use compilation process tracing as a way to analyze C++ code. PVS-Studio integrates directly with the most popular build systems for C and C++ projects. However, there are many build systems the analyzer does not support. This is because the ecosystem of C and C++ languages is extremely diverse and contains a very large number of build systems - for example, in the embedded sector.
Although the C++ PVS-Studio analyzer supports low-level direct integration with such systems, implementing this integration requires a lot of effort. For each translation unit (a C or C++ source file), compilation parameters must be passed to the analyzer.
PVS-Studio's compilation process monitoring system can simplify and automate the process of supplying the analyzer with all the information that it needs for analysis. The monitoring system collects process compilation parameters, analyzes them, and modifies them (for example, by activating the compiler's preprocessing mode, as the analyzer requires this stage only). Then the monitoring system passes these parameters to the C++ PVS-Studio analyzer directly.
This way, thanks to the process invocation monitoring feature, PVS-Studio offers a universal solution to check C and C++ projects. Moreover, the system does not depend on the build system used, is easily configured, and takes the original parameters of the source code compilation fully into account.
To read more information on that topic, refer to the documentation: "Compiler monitoring system in PVS-Studio".
Data-flow analysis is a way for the static analyzer to estimate values that variables or expressions have - across various locations in the source code. The estimated values here mean specific values, value ranges or sets of possible values. Additionally, the analyzer tracks whether memory linked to a pointer has been freed, what the array sizes are etc. Then the analyzer saves this information and processes it.

To estimate values, the analyzer tracks how variable values move along the control-flow graph. In many cases, the analyzer cannot know the variable's or expression's exact value. But the analyzer makes assumptions as to what ranges or sets of values given expressions can take at the control-flow graph's various points. To evaluate the expressions, the analyzer uses direct and indirect restrictions, imposed on the expressions as the control-flow graph is traversed.
Note. In some of our articles and reports, we call the assumed variable values "virtual".
All PVS-Studio analyzers use data-flow analysis to support the diagnostics. This is required in cases when source code's syntactic (AST) or semantic structure is insufficient for the analyzer to make a precise decision whether certain code is dangerous.
To conduct data-flow analysis, PVS-Studio analyzers use their own internally implemented algorithms. The PVS-Studio analyzer for C and C ++ and the PVS-Studio analyzer for Java use a shared internal C ++ library for data-flow analysis. The C# PVS-Studio analyzer has its own implementation of data-flow algorithms - they are in a library written in C#.
Here is an example of the data-flow analysis with the use of real Java code example of (source):
private static byte char64(char x) {
  if ((int)x < 0 || (int)x > index_64.length)
    return -1;
  return index_64[(int)x];
}
After the if-operator is executed, we see that the value of the x variable lies in the range [0..128]. Otherwise, the function will terminate prematurely. The size of the array is 128 elements, which means we have an off-by-one error. For the check to be written correctly, we need to use the >= operator.
Sometimes, when processing code, the analyzer cannot calculate an expression's range of values. In this case, the analyzer employs the symbolic execution approach. Symbolic execution means that possible variable and expression values are represented as formulas. In this case, instead of specific variable values, the analyzer operates with symbols that are abstractions of these variables.
Study this C++ code example:
int F(std::vector<int> &v, int x)
{
  int denominator = v[x] - v[x];
  return x / denominator;
}
To detect division by zero here, the analyzer does not need to know which values the function takes when this function is called.
When traversing the control-flow graph, the analyzer can build formulas for expressions it encounters. Later on, the analyzer can calculate the limitations of these expressions' values. To do this, the analyzer substitutes variables in these formulas for known limitations on symbols that a given expression depends on. The analyzer employs symbolic execution algorithms to solve the formulas it builds when traversing the control-flow graph. The algorithms allow the analyzer to calculate expression or variable value limitations based on the values of other expressions or variables.
The calculation of the final value is postponed till the moment it is required. For example, when a specific diagnostic rule is running, the final value will be calculated based on the formula created earlier.
The PVS-Studio analyzers for C, C++ and Java use the symbolic execution approach as part of their data-flow algorithms.
Interprocedural analysis is a static analyzer's ability to discover function calls and figure out how these calls affect the state of the program and its variables in the local context. The PVS-Studio analyzers use interprocedural analysis to confirm limitations and ranges of variable and expression values that are calculated with data-flow mechanisms.

During data-flow analysis, PVS-Studio's interprocedural analysis allows to account for values returned by function calls. Let's look at the example of an error in the C++ code:
int *my_alloc() { return new int; }

void foo(bool x, bool y)
{
  int *a = my_alloc();
  std::free(a);
}
If we know what called function can return, we can detect the error when memory is allocated and released through incompatible methods.
PVS-Studio also tracks the states of variables and expressions passed to functions. This enables the analyzer to detect potentially dangerous constructions and operations inside function bodies. So, the analyzer can see potential defects in the bodies of the functions called. It can also identify how values a function accepts limit values the function can return.
Let's look at the variation of the error that we have already showed before:
void my_free(void *p) { free(p); }

void foo(bool x, bool y)
{
    int *a = new int;
    my_free(a);
}
As in the previous case, the analyzer will warn you if memory is allocated through the new operator and released through the free function.
Interprocedural analysis is limited by the access to the source code of the functions the analyzer needs to expand. Although it is impossible to analyze functions defined in third-party libraries (due to the unavailability of these functions' source code) - PVS-Studio analyzers can estimate values these functions return. The annotation mechanism makes this possible.
Aside from interprocedural analysis, PVS-Studio analyzers support intermodular analysis. PVS-Studio's intermodular analysis extends the capabilities of interprocedural analysis for functions that are declared in program modules other than the one to which the current file being checked belongs.

In different programming languages, modules may mean different things. However, the concept of a module is generally understood as a compilation unit. For C and C++ languages, a compilation unit is a separate source code file (a file with the .c or .cpp extension). For C# language, a compilation unit is a project. For Java - it's a source file (a file with the .java extension) with a class herein declared.
When analyzing a project's source code file, Java and C# PVS-Studio analyzers can get access to the code of functions that are defined in this file - and in other files of the analyzed project. The PVS-Studio analyzer for C# can also get and analyze the source code of functions defined in other projects - if these projects were also submitted to the analysis.
The C++ PVS-Studio analyzer can get bodies of methods, defined in the compilation unit that is being processed at the time. This compilation unit is a preprocessed source file with expanded inclusions of header files. The C++ analyzer's intermodular mode allows to also get data-flow information from other compilation units. To do this, the analyzer works through source code twice. During the first run, the analyzer gathers interprocedural data-flow information for all source files being checked. During the second run, the analyzer uses this information to analyze source files.
If, when processing code, the analyzer encounters a function it cannot expand for analysis - it can use the function annotation mechanism. Function annotations are a declarative specification of information about limitations on values passed to functions and values that functions can return.
PVS-Studio analyzers provide two kinds of annotations: for library functions and for user functions. All PVS-Studio analyzers provide annotations on many functions from standard and popular libraries. The C++ PVS-Studio analyzer has an extra feature. You can use special syntax to set annotations for custom functions that are specific to a particular project being checked.
Currently, for example, in the analyzer for C and C++, we annotated about 7,400 functions. The following software toolkits and projects undergo manual annotation:
This allows you to set information on the behavior of functions whose bodies are not available to the analyzer. There are cases when the analyzer cannot identify on its own whether the functions are used correctly or not. For instance, let's look how the fread function is annotated:
C_"size_t fread"
  "(void * _DstBuf, size_t _ElementSize, size_t _Count, FILE * _File);"
ADD(HAVE_STATE | RET_SKIP | F_MODIFY_PTR_1,
    nullptr, nullptr, "fread", POINTER_1, BYTE_COUNT, COUNT, POINTER_2)
  .Add_Read(from_2_3, to_return, buf_1)
  .Add_DataSafetyStatusRelations(0, 3)
  .Add_FileAccessMode(4, AccessModeTypes::Read)
  .Out(Modification::BoxedValue, Arg1)
  .Out(Modification::BoxedValue, Arg4)
  .Returns(Arg3, [](const IntegerVirtualValue &v)
    { return IntegerVirtualValue { 0, v.Max(), true }; });
The annotation allows you to indicate the valid arguments. But it is much more exciting that the annotation defines the relationship between the input arguments and the return value. This allows you to detect an error of the following type:
unsigned foo(FILE *f)
{
    unsigned char buf[10];
    size_t n = fread(buf, sizeof(unsigned char), 10, f);
    unsigned sum = 0;
    for (size_t i = 0; i <= n; ++i)
       sum += buf[i];
    return sum;
}
The analyzer knows that 10 bytes can be read and therefore the variable n can take a value in the range [0..10]. Since the loop condition is written with an error, the value of the i variable can also take a value in the range [0..10].
The interaction of the annotation mechanism and data-flow analysis helps PVS-Studio to issue a message about a potential array index out of bounds if the fread function reads 10 bytes. The message will be the following: "V557 Array overrun is possible. The value of 'i' index could reach 10".
Taint analysis is a way to track how externally supplied unchecked - therefore tainted - data spreads across an application. When such data hits taint sinks, it can cause a number of security vulnerabilities: SQL injections, XSS (cross-site scripting), and many others.
Standards for secure software development, such as OWASP ASVS (Application Security Verification Standard), describe potential software vulnerabilities that result from the spread of tainted data.

Generally, it's impossible to fully protect a program from potentially tainted data. This is why the most efficient way to counteract external tainted data is to check it before it enters taint sink. This process is called data sanitization.
The PVS-Studio analyzers for C and C++, as well as for C#, can use interprocedural data-flow analysis technologies to track how tainted data spreads across applications. An entire group of PVS-Studio rules is based on the tainted data tracking mechanism.
PVS-Studio analyzers control the entire route that tainted data takes - this includes locations where data travels between program modules and where data gets checked (sanitized). If the PVS-Studio analyzer detects that tainted data travels from the taint source to the taint sink unchecked, it issues a warning about a potential code security threat. This way, PVS-Studio guards taint sources and taint sinks both, and issues a warning not only if tainted data is used - but at the moment such data is supplied to an application.
Study this C# code example:
void ProcessUserInfo()
{
  using (SqlConnection connection = new SqlConnection(_connectionString))
  {
    ....
    String userName = Request.Form["userName"];

    using (var command = new SqlCommand()
    {
      Connection = connection,
      CommandText = "SELECT * FROM Users WHERE UserName = '" + userName + "'",
      CommandType = System.Data.CommandType.Text
    })
    {
      using (var reader = command.ExecuteReader())
        ....
    }
  }
}
When writing an SQL command, the value of the userName variable is used, obtained from an external source - Request.Form. If a compromised line is used as the value (e.g., 'OR '1'='1), this will distort the logic of the request.
In this case, the analyzer will track data distribution from an external source (Request.Form) to the taint sinks (the CommandText property of the SQL command) without proper check and issue a warning.
Note that the huge part of any static analyzer is not only the number of diagnostics, but also what technologies these diagnostics are based on. It is important how diagnostics are implemented and how much attention is paid to topics such as false positives and integration into the development process.

False positives are inevitable in static analysis. Therefore, firstly, our developers put a lot of effort into reducing the number of false positives. Rarely do you want to disable PVS-Studio diagnostics, unlike many compiler warnings. This is the strength of our analyzer. Secondly, we thought over what to do with the remaining warnings and how to integrate the analyzer into a large project.
Come try the PVS-Studio analyzer by requesting a free trial license.

0